Parallel Help
Back to Top
Should I use Automatic or the
Manual Thread Allocation Scheme?
Assuming you have enough memory and disk space, the
way to maximize throughput is to run multiple molecules in
parallel, with each molecule using only 1 physical core.
The quickest way to complete a single molecule is to run one
molecule at a time using multiple cores.
The Automatic Core/Thread Allocation algorithm chooses
between these extremes by
detecting if you are running multiple molecules or just a single
job, respectively.
In most cases, it makes sense to use this
default Automatic setting.
You may want to override this Automatic algorithm with
the Manual algorithm.
To do so it is useful to benchmark performance
on your machine.
(In general this is very
cpu-brand, cache-size, etc. and task type dependent.)
For benchmarking performance for Spartan'18 Parallel Suite on
your machine, use
Parallel Test File.
The procedure for running the file is:
- Open Spartan Parallel Suite
-
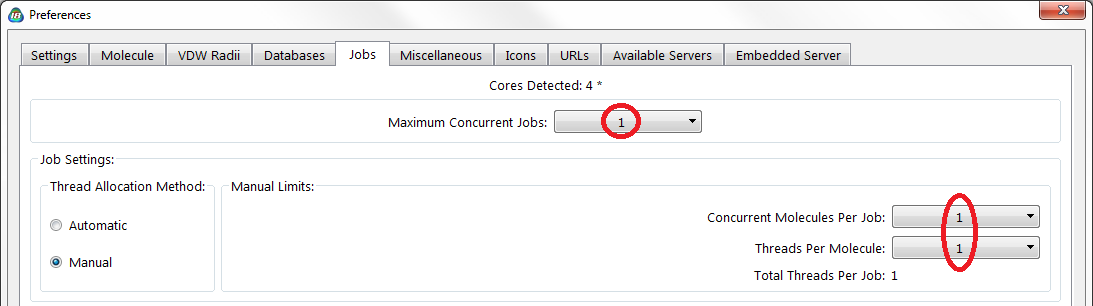
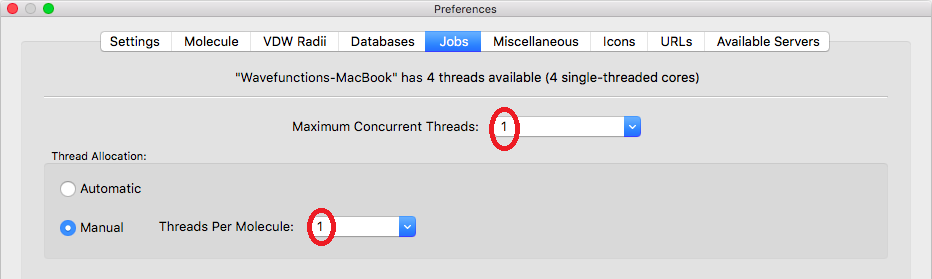
Go to the Options Menu -> Preferences -> Jobs tab
and change the default settings as follows.
Set the Maximum Concurrent Jobs/Threads to 1,
entering Manual mode, and set
Concurrent Molecules Per Job as well as Threads Per
Molecule to 1.
-
Examples of what the panel should look like are shown below
for Windows and Mac OSX:
- Open the
Parallel Test File
(click on link) and save as ParallelTest.spartan,
then submit this job (Setup Menu -> Submit).
- When finished, (~30 min.) you will have 4 plots that look at
computation times as a function of # of cores (up to 8 cores)
[You may need to rescale or move different plots to see to
entire curves.]
- Reset the Jobs tab back to default, or whatever values you
are comfortable with.
Some discussion on these plots is probably required.
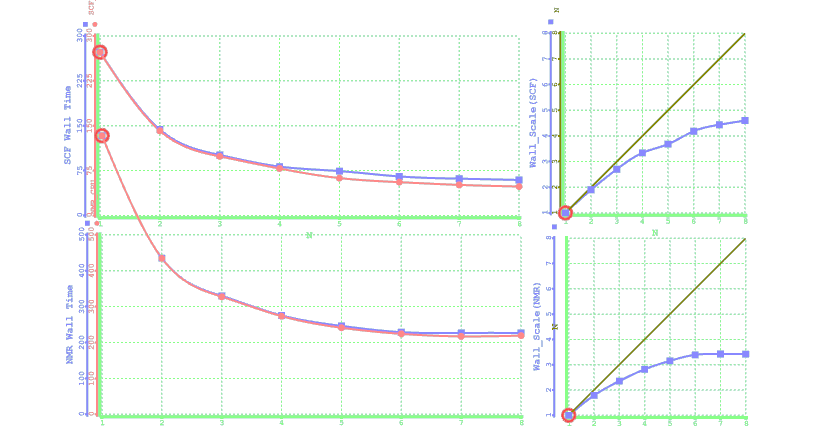
The top two plots examine a (single point) energy
calculation.
The bottom two plots consider an NMR calculation.
The wide charts show "Wall" and "Theoretical cpu" time for
the job using a different number of cores/threads. You should
focus on the "Wall Time" which will always be greater than CPU
time.
The Square plots represent the same Wall Time data, but are
scaled to be in units of "Speed Up per core".
Optimal performance is represented by the diagonal line.
On many modern CPUs, if only one core is being used the chip
can increase its CPU frequency making that 1 core faster than
normal. Thus scaling may look worse than it really is.
It is not unusual for the time to actually slow down, once the
resources of your machine is "maxed out". It would make no
sense to run any job with more cores than this. Usually there
is a point of "Diminishing returns" but the location of this
"point" is really a personal preference and based on your work
style.
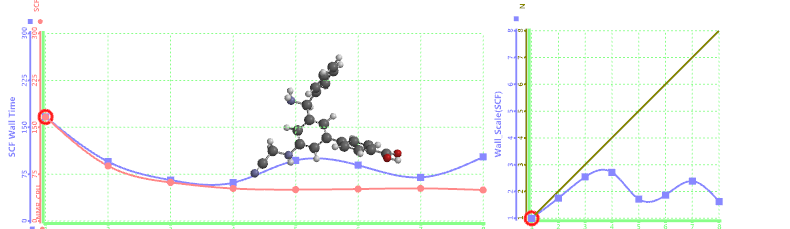
As an example, let's examine the plot shown below. This is from
a 2 core multi-threaded (Intel CPU) on a machine which runs
some jobs, but also runs other programs. Clearly using more than 4
threads is not a good idea, and 4 is not much better than 3.
It might make sense only run 1 job at a time on this machine, and to
allow it to use 3 threads, giving the system (or other programs)
a thread to do other light weight work.
Depending on your work flow other choices will make sense.
On my desktop machine I typically only run one job at a time,
but use only half the number of threads (2 in this example).
In my environment there is almost always
a single job running (often a list containing multiple
molecules). If there is another job that needs to finish quickly,
one can submit this, then go to the
Monitor (Options menu > Monitor),
right-click on the new job's name and
choose Start. In my case, since there are spare
threads, the newly submitted job runs well (does not
compete for threads).
Back to Top
support@wavefun.com