![]() 3D –
Creating and Displaying 3D Models
3D –
Creating and Displaying 3D Models
All iSpartan 3D modeling operations are performed in the 3D pane. Drawings made in the Sketch pane (or retrieved from the Gallery) are automatically converted into 3D molecular models upon moving to the 3D pane. The 3D pane also provides tools for adjusting a model’s appearance, for learning about its properties, and for setting up calculations.
Choice of computational method. Perhaps the most daunting aspect of molecular modeling involves choosing a computational method. Every method for calculating model properties involves physical and numerical approximations, and it is these approximations that are responsible for gaps between models and the real molecules they seek to portray. Every method of computation leads to a world of molecular models with its own special characteristics, a so-called “model chemistry”.
While traditional modeling programs offer an assortment of computational methods (and thereby force the user to choose among them), iSpartan takes a different approach. In order to make modeling easy and convenient, iSpartan accesses only three computational methods. A single method is used for all molecular mechanics (MM) calculations, and two methods are used for quantum mechanics (QM) calculations. These methods are described in computational methods in iSpartan. Results from the two quantum chemical methods are provided in the database and may be obtained for molecules not in the database using iSpartan Server. The key points to remember are that the MM and QM methods in iSpartan have been chosen because they provide results of high quality for a wide variety of molecular systems while still being practical in terms of computation time.
Molecular Mechanics vs. Quantum Mechanics. Although certain features of models can, in principle, be calculated using both MM and QM methods, iSpartan chooses a specific MM or QM calculation method for each task:
· Conversion of 2D drawing into 3D model ® MM
· Conformer searching and ranking of conformers ® MM
· Geometry, energy and atomic charges calculations ® QM
· IR and NMR spectra calculations ® QM
· Heat of formation calculation ® QM
· Models retrieved from a database search ® QM
The following sections provide detailed instructions for using the 3D pane, the computational methods in iSpartan, and guidance on times for calculations performed with iSpartan Server.
· Computational methods in iSpartan
· Estimating times for calculations on iSpartan Server
Molecular models in the 3D pane can be manipulated in several ways. Models are rotated by dragging a finger (or stylus) across the screen. Dragging a finger up or down along the extreme right or left edge of the screen rotates the model around the axis perpendicular to the screen. Two-finger gestures, “pinch", "spread” and “drag”, are used to change a model’s size and screen position.
Tapping one of the following 3D icons produces different results depending on what model data are available:
|
|
|
|
|
|
|
|
|
|
|
MODEL |
CONFORMER |
DATABASE LOOKUP/ |
MOLECULAR |
ELECTROSTATIC |
MODEL INFORMATION |
INFRARED |
PROTON NMR |
CARBON NMR |
· MODEL – tube, ball-and-spoke, space-filling models, R/S labels
· CONFORMER SEARCH – MM conformer search
· DATABASE LOOKUP / SERVER CALCULATE – lookup in the database; if not available, request to set up QM calculations (geometry, charges, energy, heat of formation, spectra)
· MOLECULAR ORBITALS – molecular orbital (MO) energy diagram and surfaces (HOMO, LUMO and neighboring MOs only)
· ELECTROSTATIC POTENTIAL MAP – solid contour, solid continuous, transparent, and mesh maps, adjustable map scale
· MODEL INFORMATION – molecular and atomic properties, geometrical parameters (distance, angle, dihedral angle)
· INFRARED – IR spectrum, vibration frequencies, vibration modes (animated)
· PROTON NMR – 1H NMR spectrum with and without vicinal (3-bond) HH coupling, ability to remove selected peaks for clarity and overlay a (user-supplied) experimental spectrum onto the calculated spectrum and calculate errors
· CARBON NMR – Proton-decoupled 13C NMR spectrum, ability to remove selected peaks for clarity, and overlay a (user-supplied) experimental spectrum onto the calculated spectrum and calculate errors
Back to 3D – Creating and Displaying Models
How to use 3D. Molecular models in the 3D pane are rotated by dragging a finger (or stylus) across the screen. Models can be rotated around the axis perpendicular to the plane of the screen by dragging a finger up or down along the extreme right or left edge of the screen. The size of the model can be adjusted using the two-finger “pinch (or spread)” gesture and its position can be adjusted up and down, or left and right, using the two-finger “drag” gesture. All other operations in the 3D pane are performed by tapping one of the 3D icons as described below.
|
|
|
|
|
|
|
|
|
|
|
MODEL |
CONFORMER |
DATABASE LOOKUP/ |
MOLECULAR |
ELECTROSTATIC |
MODEL INFORMATION |
INFRARED |
PROTON NMR |
CARBON NMR |
· convert a 2D drawing into a 3D model
· adjust the appearance of a model (orientation, size, screen position)
· display ball-and-spoke, space-filling, and tube models
· display configuration (R/S) labels
· display molecular orbital energies and surfaces
· display & adjust electrostatic potential maps
· display molecular properties
· display geometrical parameters: distances, angles, dihedral angles
· display & adjust the infrared (IR) spectrum
· display & adjust the proton (1H) NMR spectrum
· display & adjust the carbon (13C) NMR spectrum
· perform an MM conformer search
· look for a QM model in the database
· perform a QM calculation using iSpartan Server
· clear the screen for a new model
· save a model in the Gallery for later use
· open a model from the Gallery
· save spectrum in photo gallery
· save conformer energy plot in photo gallery
· e-mail conformer energy plot
· save orbital energy plot in photo gallery
· start iSpartan from a Spartan file attached to an email
How to convert a 2D drawing into a 3D
model. After a drawing has been made in the Sketch
pane, tap ![]() to convert it into a 3D model. A short delay
occurs when a model is relatively large and/or flexible due to the time needed
for the molecular mechanics calculation used to optimize atom positions
(geometry) in the 3D model.
to convert it into a 3D model. A short delay
occurs when a model is relatively large and/or flexible due to the time needed
for the molecular mechanics calculation used to optimize atom positions
(geometry) in the 3D model.
How to adjust the appearance of a model (orientation, size, screen position). You can rotate a model, change its size, and move it across the screen. Drag one finger across the screen to rotate the model. Drag two fingers across to screen to move the model. Pinch two fingers together to make the model smaller. Spread two fingers apart to make the model larger. Drag one finger along the far right (or far left) edge of the screen to rotate the model around the axis perpendicular to the plane of the screen.
How to display
ball-and-spoke, space-filling, and tube models. Models
are initially displayed as ball-and-spoke models (![]() ). Long press on the MODEL
icon (initially displayed as
). Long press on the MODEL
icon (initially displayed as ![]() ) to display a menu with other models. Tap
) to display a menu with other models. Tap
![]() to
display a tube model,
to
display a tube model, ![]() to display a ball-and-spoke model, or
to display a ball-and-spoke model, or ![]() to
display a space-filling model. The MODEL icon will be updated to reflect
your last menu choice.
to
display a space-filling model. The MODEL icon will be updated to reflect
your last menu choice.
How
to display configuration (R/S) labels. Long
press on the MODEL icon (initially displayed as ![]() ) and tap
R/S in the resulting menu to display a ball-and-spoke model with R/S
labels superimposed on chiral atoms. The MODEL icon will be displayed as
R/S.
) and tap
R/S in the resulting menu to display a ball-and-spoke model with R/S
labels superimposed on chiral atoms. The MODEL icon will be displayed as
R/S.
R/S configurations of
individual atoms can also be obtained from the Atom tab accessible from
the MODEL INFORMATION dialog. Tap the MODEL INFORMATION
icon ![]() to open
the MODEL INFORMATION dialog. Tap the Atom tab at
the top of the dialog and then tap the chiral atom of interest in
the model. A gold sphere or circle will identify the selected atom and the
configuration will be reported in the dialog. (Achiral atoms are reported as N/A.)
Tap a second time to deselect the atom or tap on a
different atom to select it instead.
to open
the MODEL INFORMATION dialog. Tap the Atom tab at
the top of the dialog and then tap the chiral atom of interest in
the model. A gold sphere or circle will identify the selected atom and the
configuration will be reported in the dialog. (Achiral atoms are reported as N/A.)
Tap a second time to deselect the atom or tap on a
different atom to select it instead.
How
to display molecular orbital energies and surfaces. Tap
the MOLECULAR ORBITALS icon ![]() . This displays a chart that
shows the energies of the ten highest energy occupied orbitals (HOMO through
HOMO-9) and the two lowest energy unoccupied orbitals (LUMO and LUMO+1). Tap
the icon again to hide the chart and the orbital.
. This displays a chart that
shows the energies of the ten highest energy occupied orbitals (HOMO through
HOMO-9) and the two lowest energy unoccupied orbitals (LUMO and LUMO+1). Tap
the icon again to hide the chart and the orbital.
Tap an energy level in this chart to display the corresponding orbital and energy (in eV). Once one orbital has been displayed, swipe your finger up or down the chart to display the next higher (or lower) energy orbital. Alternatively, tap on any energy level in the chart to display that orbital.
Molecular orbitals are available only for models that have been retrieved from the database or obtained from a QM calculation using iSpartan Server. Learn more about computational methods in iSpartan.
How to display & adjust
electrostatic potential maps. Tap the
ELECTROSTATIC POTENTIAL MAP icon ![]() . This displays an
electrostatic potential map and a legend showing how potentials (in kJ/mol) are
displayed using different colors. Tap the icon again to hide the
map and legend.
. This displays an
electrostatic potential map and a legend showing how potentials (in kJ/mol) are
displayed using different colors. Tap the icon again to hide the
map and legend.
Maps are initially displayed
as solids with color contours. Long press on ![]() to display
a menu of other options. Tap a menu entry to change the map
display from solid contour
to display
a menu of other options. Tap a menu entry to change the map
display from solid contour ![]() to solid continuous
to solid continuous ![]() , or transparent
, or transparent ![]() ,
or mesh
,
or mesh ![]() .
.
The range of potentials shown in the map depends on the molecular model’s total charge. For neutral molecules, locations for which the potential is most negative are shown in red, whereas locations for which the potential is most positive are shown in dark blue. Intermediate colors "in the rainbow", light blue, cyan, green, yellow and orange, depict locations for which the potential is in between the limits. Potentials for cations will generally always be positive irrespective of location, while those for anions will generally always be negative. However, the same color scheme is employed (red corresponds to the most negative or least positive location and dark blue to the most positive or least negative location. Potentials that are larger (or smaller) than the range covered by the map legend, are also displayed as dark blue (or red).
The range of potentials can be adjusted using two-finger gestures on the legend. First, tap the legend to select it (a gold rectangle will surround the legend), then pinch two fingers over the legend to reduce the range or spread two fingers over the legend to expand the range. The colors on the potential map are automatically updated to correspond to those in the legend.
To “measure” the value of the potential at a particular location on the map, tap on that location. A pointer marks the spot, and the numerical value of the potential is provided alongside the legend. Note that this does not depend on the range selected for map.
Electrostatic potential maps are available only for models that have been retrieved from the database or obtained from a QM calculation using iSpartan Server. Learn more about computational methods in iSpartan.
How to display molecular
properties. Tap the MODEL INFORMATION
icon ![]() and tap
on the Molecule tab at the top of the dialog. The molecular formula and
molecular weight will be reported, along with the area, volume and polar
surface area (PSA) of a space-filling model. PSA refers to the exposed surface
area due to nitogen and oxygen as well as any hydrogens attached to nitrogen or
oxygen, and provides a rough measure of how likely a molecule is to be soluble
in water. Another measure of this, termed LogP, is also provided. Both the heat
of formation (in kJ/mol) estimated from the T1 QM method and total energy (in
atomic units) resulting from the QM calculation are available, but only one is
shown. Tap on the icon (Heat of Formation or Total
Energy) to show the other. Finally, the dipole moment (in debyes) is
provided. Tap on
and tap
on the Molecule tab at the top of the dialog. The molecular formula and
molecular weight will be reported, along with the area, volume and polar
surface area (PSA) of a space-filling model. PSA refers to the exposed surface
area due to nitogen and oxygen as well as any hydrogens attached to nitrogen or
oxygen, and provides a rough measure of how likely a molecule is to be soluble
in water. Another measure of this, termed LogP, is also provided. Both the heat
of formation (in kJ/mol) estimated from the T1 QM method and total energy (in
atomic units) resulting from the QM calculation are available, but only one is
shown. Tap on the icon (Heat of Formation or Total
Energy) to show the other. Finally, the dipole moment (in debyes) is
provided. Tap on ![]() to hide the dialog.
to hide the dialog.
The heat of formation, total energy and dipole moment are available only for models that have been retreived from the database or obtained from a QM calculation using iSpartan Server. The other properties are dervived from the current geometry, and will vary somewhat depending on whether MM of QM has been used to calculate this geometry. Learn more about computational methods in iSpartan.
How to display atomic
properties. Tap the MODEL PROPERTIES
icon ![]() and tap
on the Atom tab at the top of the dialog. Tap on an atom
to display the Chemical Shift (in ppm), the vicinal (three-bond) HH
coupling constants 3J (in Hz) and the Charge (in electrons).
The R/S configuration is also provided (N/A for an achiral atom).
Tap on another atom to select it or on the selected atom to
deselect. Tap on
and tap
on the Atom tab at the top of the dialog. Tap on an atom
to display the Chemical Shift (in ppm), the vicinal (three-bond) HH
coupling constants 3J (in Hz) and the Charge (in electrons).
The R/S configuration is also provided (N/A for an achiral atom).
Tap on another atom to select it or on the selected atom to
deselect. Tap on ![]() to hide the dialog.
to hide the dialog.
Chemical shifts and charges are available only for models that have been retreived from the database or obtained from a QM calculation on the server. Learn more about computational methods in iSpartan. Coupling constants depend on the current model geometry and are estimated by an empirical formula that uses the H-C-C-H torsion angle together with other correction factors.
How to display geometrical parameters: distances, angles, dihedrals. Tap the MODEL INFORMATION icon, tap on the tab at the top of the dialog corresponding to the desired parameter (Distance, Angle, Dihedral), and then tap the atoms needed to define the parameter. The value of the parameter is displayed in the dialog window once all of the atoms have been selected.
The selected atoms are indicated in the model by gold circles. Tap (select) adds a gold circle to an atom. A second tap (deselect) on the same atom removes the circle. To repeat this process for several values, just continue to tap atoms. In other words, tap A and B to get distance A-B, then tap C and D to get distance C-D. Remember that angles and dihedral angles, unlike distances, depend on atom sequence. The angle A-B-C is almost never the same as the angle B-A-C.
How
to display & adjust the infrared (IR) spectrum. Tap the
INFRARED icon ![]() . This displays the calculated infrared
spectrum, 4000 to 500 cm-1. Tap the icon again to hide
the spectrum.
. This displays the calculated infrared
spectrum, 4000 to 500 cm-1. Tap the icon again to hide
the spectrum.
The appearance of the spectrum can be adjusted by making two-finger gestures on the spectrum. Use a two-finger pinch or spread to reduce or expand the spectral window, respectively. Use a two-finger drag to the left (or right) to move the spectral window left (or right), respectively. Double tap the spectrum to restore the original spectrum settings, 4000 to 500 cm-1.
The positions of individual peaks and the corresponding vibration modes can be displayed using a cursor. Tap anywhere on the spectrum. This will display two small black triangles marking the frequency where you tapped (the frequency is displayed underneath the bottom triangle). Tap on an IR peak and a yellow line (the “cursor”) will also be drawn between the two triangles and the atoms in the model will “vibrate” to show the vibration mode associated with this peak. Drag one finger across the spectrum to move the triangles/cursor continuously and lift your finger to read the current frequency.
Infrared spectra are available only for models that have been retrieved from the database or obtained from a QM calculation using iSpartan Server. Learn more about computational methods in iSpartan.
How
to display & adjust the proton (1H) NMR spectrum. Tap
the PROTON NMR icon ![]() . This displays the calculated 1H NMR spectrum,
10 to 0 ppm. Tap the icon again (or tap a different
icon) to hide the spectrum.
. This displays the calculated 1H NMR spectrum,
10 to 0 ppm. Tap the icon again (or tap a different
icon) to hide the spectrum.
The spectrum initially
displayed is based on chemical shifts derived from QM calculations and vicinal
(3-bond) HH coupling constants derived from empirical formulas. Geminal (2-bond)
and long range couplings are not displayed. An “idealized” proton spectrum that
omits all proton-proton couplings may also be displayed. Long press
on ![]() to display a menu with two options. Tap
to display a menu with two options. Tap
![]() to
display an uncoupled proton spectrum.
to
display an uncoupled proton spectrum.
Tap ![]() to
display the more familiar spectrum.
to
display the more familiar spectrum.
The appearance of the spectrum can be adjusted by making two-finger gestures on the spectrum. Perform a two-finger pinch or spread to reduce or expand the spectral window, respectively. Perform a two-finger drag to the left or right to move the spectral window left or right, respectively. Double tap the spectrum to restore the original spectrum settings, 10 to 0 ppm (relative to TMS).
The chemical shifts of individual peaks and the protons responsible for these peaks can be displayed. Tap anywhere on the spectrum. This will display two small black triangles marking the chemical shift where you tapped (the shift is displayed above the top triangle). Tap on a line or coupling pattern in the spectrum and a yellow line (the “cursor”) will be drawn between the two triangles. In addition, the atoms in the model responsible for this line or coupling pattern will be circled in gold. Alternatively, tap on a hydrogen in the model and the cursor will move to the line or coupling pattern associated with this proton.
If more than one proton
contributes to a line or coupling pattern, iSpartan reports a
single shift for all of the protons in the group. If the protons are related by
symmetry, the reported shift is actually the shift calculated for each proton.
However, if the protons are made equivalent by a conformational equilibrium,
the reported shift is an average shift based on the assumption of fast site
exchange. Moving the cursor to this line, or tapping any proton in this group,
will highlight all of the equivalent protons in the group. Additional
operations can be accessed from the chemical shift dialog. Display the
proton-decoupled spectrum and tap on![]() at the upper left of the spectrum . The
dialog allows individual lines to be hidden, the overlay of experimental lines
alongside calculated lines, and the overlay of proton shifts on the 3D model.
Only five lines are displayed in the dialog at one time. To access the other lines,
drag your finger up and down over the calculated shifts.
at the upper left of the spectrum . The
dialog allows individual lines to be hidden, the overlay of experimental lines
alongside calculated lines, and the overlay of proton shifts on the 3D model.
Only five lines are displayed in the dialog at one time. To access the other lines,
drag your finger up and down over the calculated shifts.
To hide a calculated line in the spectrum, tap the ON switch next to the line so that it reads OFF. To display the line again, tap the OFF switch so that it reads ON. To display an experimental line in the spectrum, tap the box to the right of the ON/OFF switch and type the experimental shift. Experimental lines are displayed in blue. To hide an experimental line, simply delete whatever shift has been typed in the box. To display the calculated shifts as an overlay on the 3D model, tap the OFF switch to the right of Atom Labels. Note that operations specified are in the chemical shift dialog are only performed on the spectrum after you tap DONE.
Three error statistics are displayed in the chemical shift dialog once experimental chemical shifts have been supplied: RMS (root-mean-square error), Max∆ (maximum error) and GMT (geometric mean of t-distribution error). This last quantity is a numerical parameter that is related to the likelihood that the correct structure could have yielded these errors . Larger GMT values indicate a higher likelihood that the observed errors fall within expected ranges and that the model structure is correct.
Proton NMR spectra are available only for models that have been retrieved from the database or obtained from a QM calculation using iSpartan Server. Learn more about computational methods in iSpartan.
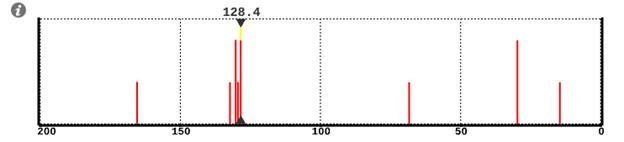
How
to display & adjust the carbon (13C) NMR spectrum. Tap the
CARBON NMR icon ![]() . This displays the calculated 13C NMR
spectrum. Tap the icon again (or tap a different
icon) to hide the spectrum.
. This displays the calculated 13C NMR
spectrum. Tap the icon again (or tap a different
icon) to hide the spectrum.
The spectrum initially displayed is based on chemical shifts derived from QM calculations and is displayed as proton-decoupled spectrum.
The appearance of the spectrum can be adjusted by making two-finger gestures on the spectrum. Perform a two-finger pinch or spread to reduce or expand the spectral window, respectively. Perform a two-finger drag to the left or right to move the spectral window left or right, respectively. Double tap the spectrum to restore the original spectrum settings, 200 to 0 ppm (relative to TMS).
The chemical shifts of individual peaks and the carbons responsible for these peaks can be displayed. Tap anywhere on the spectrum. This will display two small black triangles marking the chemical shift where you tapped (the shift is displayed above the top triangle). Tap on a line in the spectrum and a yellow line (the “cursor”) will be drawn between the two triangles. In addition, the atoms in the model responsible for this line will be circled in gold. Alternatively, tap on a carbon in the model and the cursor will move to the line associated with this carbon.
If more than one carbon contributes to a line, iSpartan reports a single shift for all of the carbons in the group. If the carbons are related by symmetry, the reported shift is actually the shift calculated for each carbon. However, if the carbons are made equivalent by a conformation equilibrium, the reported shift is an average shift based on the assumption of fast site exchange. Moving the cursor to this line, or tapping any carbon in this group, will highlight all of the equivalent carbons in the group.
Additional operations can be
accessed from the chemical shift dialog. Tap on![]() at the upper
left of the carbon spectrum. The dialog allows individual lines to be hidden, the
overlay of experimental lines alongside calculated lines, and the overlay of
carbon shifts on the 3D model. Only five lines are displayed in the dialog at
one time. To access the other lines, drag your finger up and
down over the calculated shifts.
at the upper
left of the carbon spectrum. The dialog allows individual lines to be hidden, the
overlay of experimental lines alongside calculated lines, and the overlay of
carbon shifts on the 3D model. Only five lines are displayed in the dialog at
one time. To access the other lines, drag your finger up and
down over the calculated shifts.
To hide a calculated line in the spectrum, tap the ON switch next to the line so that it reads OFF. To display the line again, tap the OFF switch so that it reads ON. To display an experimental line in the spectrum, tap the box to the right of the ON/OFF switch and type the experimental shift. Experimental lines are displayed in blue. To hide an experimental line, simply delete whatever shift has been typed in the box. To display the calculated shifts as an overlay on the 3D model, tap the OFF switch to the right of Atom Labels. Note that operations specified are in the chemical shift dialog are only performed on the spectrum after you tap DONE.
Three error statistics are displayed in the chemical shift dialog once experimental chemical shifts have been supplied: RMS (the root-mean-square error), Max∆ (the maximum error) and GMT (geometric mean of t-distribution error). This last quantity is a numerical parameter that is related to the likelihood that the correct structure could have yielded these errors. Larger GMT values indicate a higher likelihood that the observed errors fall within expected ranges and that the model structure is correct.
Carbon NMR spectra are available only for models that have been retrieved from the database or obtained from a QM calculation using iSpartan Server. Learn more about computational methods in iSpartan.
How to perform an MM
conformer search. Tap ![]() to
start a conformer search. This is based on molecular mechanics, and requires
only a few seconds for a small molecule, but may take up to several minutes for
a larger and more flexible molecule. Tap
to
start a conformer search. This is based on molecular mechanics, and requires
only a few seconds for a small molecule, but may take up to several minutes for
a larger and more flexible molecule. Tap ![]() at the top of the
screen to stop the search at any time. To restart the search from where it was
interrupted, long press on
at the top of the
screen to stop the search at any time. To restart the search from where it was
interrupted, long press on ![]() and tap
and tap ![]() in
the menu that results. To start from the beginning, tap
in
the menu that results. To start from the beginning, tap ![]() from
the menu. Upon completion (or termination) of a conformational search, a
conformer energy chart will appear at the left of the screen.
from
the menu. Upon completion (or termination) of a conformational search, a
conformer energy chart will appear at the left of the screen.
The lines in the chart designate the low-energy conformers resulting from the search. Energies relative to the lowest-energy conformer (energy = 0) are marked in kJ/mol on the left axis and kcal/mol on the right axis. No more than 25 conformers are displayed. The display is further limited to conformers that are within 25 kJ/mol of the lowest-energy conformer. The lowest-energy conformer is initially selected (red line in chart) and its structure is shown on the screen. To select another conformer, tap on its line. Alternatively, swipe your finger up over the conformer energy chart to display the next best conformer.
If you had started with a
molecule that was in the database and wish to return to it, tap ![]() , and then tap
Replace in the dialog that results. Note that the entry in the database
may not correspond to the lowest-energy conformer identified in the search
(different criteria are used). If you want to perform a QM calculation on one
or more of the individual conformers (assuming that you have access to a
server), first save the results of the conformer search (tap the Gallery
tab at the bottom of the screen and provide a name). Then, for each conformer
that you want to calculate, bring back the conformer search results and select
a conformer. Tap
, and then tap
Replace in the dialog that results. Note that the entry in the database
may not correspond to the lowest-energy conformer identified in the search
(different criteria are used). If you want to perform a QM calculation on one
or more of the individual conformers (assuming that you have access to a
server), first save the results of the conformer search (tap the Gallery
tab at the bottom of the screen and provide a name). Then, for each conformer
that you want to calculate, bring back the conformer search results and select
a conformer. Tap ![]() and select Calculate in the dialog that
results. This will lead to the Calculate dialog. (See How to perform a QM calculation.)
Specify what you want to calculate, provide a unique name and tap
Compute.
and select Calculate in the dialog that
results. This will lead to the Calculate dialog. (See How to perform a QM calculation.)
Specify what you want to calculate, provide a unique name and tap
Compute.
How to look for a QM model
in the database. Tap ![]() to
start a database search. If a model is found, it will be returned immediately
with the name of the molecule and CAS number (if available) displayed at the
bottom of the screen. The structure from the database (which is based on a QM
calculation) will replace the initial structure and all functions in the 3D
pane will be accessible.
to
start a database search. If a model is found, it will be returned immediately
with the name of the molecule and CAS number (if available) displayed at the
bottom of the screen. The structure from the database (which is based on a QM
calculation) will replace the initial structure and all functions in the 3D
pane will be accessible.
How to perform a QM
calculation using iSpartan Server. Tap ![]() .
If the model does not exist in the database and if iSpartan Server
is not available, a message will be provided pointing you to the Wavefunction website
for information about obtaining iSpartan Server. If, on the other
hand, the model does not exist in the database and iSpartan Server
is available, the Calculate dialog is provided. (Note, that database
access is not permitted following an MM conformer search. See How to perform an MM
conformer search.)
.
If the model does not exist in the database and if iSpartan Server
is not available, a message will be provided pointing you to the Wavefunction website
for information about obtaining iSpartan Server. If, on the other
hand, the model does not exist in the database and iSpartan Server
is available, the Calculate dialog is provided. (Note, that database
access is not permitted following an MM conformer search. See How to perform an MM
conformer search.)
The equilibrium geometry, total energy, and wave function (the last provides access to molecular orbitals and the electrostatic potential map) are always calculated. Additional options include the calculation of NMR and IR spectra and the heat of formation. An estimate of the total time required for computation on the server is provided. This may range from several minutes to several hours, depending on the size of the molecule, the options that are selected, and the capability of the server. For additional information, see estimating times for calculations on Spartan Server. Note, that while an NMR spectrum adds very little to the overall calculation time, an IR spectrum adds a significant amount. A warning is provided.
Once a calculation has been submitted to Spartan Server (tap Compute), you are free to perform all other iSpartan tasks, including creating and saving new models. More than one calculation can be submitted to the server, and they will be returned in the order that they are completed. (You will be notified as soon as the calculation has completed).
How to clear the screen for a new model.
Tap on Sketch at the bottom of the screen and tap on the Sketch Palette.
How
to save a model in the Gallery for later use. Tap ![]() at
the bottom of the screen, (optionally) provide a name and tap Save.
This will add the model to the Gallery and simultaneously shift the app
into Gallery mode. If you do not provide a name, the molecular formula
will be used, e.g., C2H6O. You can rename the model in
the Gallery using the Edit feature.
at
the bottom of the screen, (optionally) provide a name and tap Save.
This will add the model to the Gallery and simultaneously shift the app
into Gallery mode. If you do not provide a name, the molecular formula
will be used, e.g., C2H6O. You can rename the model in
the Gallery using the Edit feature.
If you tap Don’t Save instead of Save, you can inspect all of the drawings and models in the Gallery, but the current model will not be saved in the Gallery.
How to open a model from the
Gallery. Tap ![]() , locate and double tap
on the model of interest.
, locate and double tap
on the model of interest.
How to save model in photo gallery.
Tap ![]() at
the top right of the screen and select Save Model Photo from the
menu.
at
the top right of the screen and select Save Model Photo from the
menu.
Tap ![]() at the top right of the
screen and select E-mail Model from the menu.
at the top right of the
screen and select E-mail Model from the menu.
How to save spectrum in photo gallery.
With a spectrum displayed, tap ![]() at
the top right of the screen and select Save Spectrum Photo from
the menu.
at
the top right of the screen and select Save Spectrum Photo from
the menu.
With a spectrum displayed, tap ![]() at
the top right of the screen and select E-mail Spectrum from the menu.
at
the top right of the screen and select E-mail Spectrum from the menu.
How to save conformer energy plot in photo gallery.
With a conformer energy plot displayed, tap ![]() at
the top right of the screen and select Save Conformer Plot Photo from
the menu.
at
the top right of the screen and select Save Conformer Plot Photo from
the menu.
How to e-mail conformer energy plot.
With a conformer energy plot displayed, tap ![]() at
the top right of the screen and select E-mail Conformer Plot from the
menu.
at
the top right of the screen and select E-mail Conformer Plot from the
menu.
How to save orbital energy plot in photo gallery.
With a orbital energy plot displayed, tap ![]() at
the top right of the screen and select Save Orbital Plot Photo from the
menu.
at
the top right of the screen and select Save Orbital Plot Photo from the
menu.
How to e-mail orbital energy plot.
With a orbital energy plot displayed, tap ![]() at
the top right of the screen and select E-mail Orbital Plot from the
menu.
at
the top right of the screen and select E-mail Orbital Plot from the
menu.
iSpartan uses standard .spartan files that
can be passed via e-mail to another iPad or iPhone or to Spartan
operating on a PC or Mac. To e-mail the file open in iSpartan, tap
![]() at the top right of the screen and select e-mail Spartan
File from the menu. Information obtained from access to the database or
from a calculation using Spartan Server is
contained in this file. In the absence of database access/computation the file
contains only the 3D geometry (from molecular mechanics).
at the top right of the screen and select e-mail Spartan
File from the menu. Information obtained from access to the database or
from a calculation using Spartan Server is
contained in this file. In the absence of database access/computation the file
contains only the 3D geometry (from molecular mechanics).
How to start iSpartan from a Spartan file attached to an e-mail.
Tap on the attachment to the e-mail and tap
on Open in iSpartan in the menu that results. ![]() at
the top right of the screen and select e-mail Spartan File from the
menu. Note that only the first molecule in a multi-molecule .spartan file will
be displayed. Note also, that whereas the results of any calculation method may
be read by iSpartan, the correction schemes for NMR and IR
spectra are specific to the EDF2/6-31G* method.
at
the top right of the screen and select e-mail Spartan File from the
menu. Note that only the first molecule in a multi-molecule .spartan file will
be displayed. Note also, that whereas the results of any calculation method may
be read by iSpartan, the correction schemes for NMR and IR
spectra are specific to the EDF2/6-31G* method.
Back to 3D – Creating and Displaying Models
Computational Methods in iSpartan
Traditional modeling programs offer an assortment of computational methods to the user. Because the time required for a computation is inversely related to the number of approximations used in the computation, it has always seemed reasonable to let the user locate, usually through trial-and-error "experiments", a suitably rewarding balance between computational effort and approximation. The obvious "upside" is unfettered access to a wide range of methods. The "downside" is the burden of actually having to carry out the "experiments".
iSpartan addresses these same issues, time and approximation, from a very different perspective. Rather than provide the user with a large number of computational options that can only be explored through time-consuming experimentation, iSpartan aims to provide models of meaningful accuracy in the shortest time possible. To do this, only three computational methods are accessed: molecular mechanics (MM) based on the Merck Molecular Force Field (MMFF)1, quantum mechanics (QM) based on density functional theory (DFT) using the EDF22 functional and the 6-31d (6-31G*) basis set3, and QM based on the T1 thermochemical recipe for heat of formation calculations4. Furthermore, as described below, iSpartan calls upon each method for a particular type of computation. There are no menus in which a user might select among different methods.
- Conversion of structural formula into 3D model → MM
- Conformer searching and ranking → MM
- Basic Spartan Server calculations: geometry, electronics, energy → DFT (QM)
- Optional Spartan Server calculation: IR* → DFT (QM)
- Optional Spartan Server calculation: NMR* → DFT (QM)
- Optional Spartan Server calculation: heat of formation → T1 (QM)**
- Models retrieved from database → DFT (QM) with T1 (QM) heats of formation
*The DFT results for IR and NMR peak positions are scaled using empirical schemes that have been developed using standard groups of test molecules. iSpartan reports the scaled peak positions, not the original DFT values. IR intensities are directly calculated. NMR intensities are assumed to be proportional to the number of identical atoms. Vicinal (three-bond) HH coupling constants (3JHH) are obtained from empirical relationships based on geometry and bond orders.
**All other properties (geometry, charges, etc.) of a model that has been subjected to a heat of formation calculation are derived from the DFT method. The T1 recipe is used solely to generate the heat of formation.
The philosophy underlying iSpartan’s approach to computation reflects what we believe are the real-world needs of chemists and students, namely, the solving of a chemical problem. Problems are solved with the help of useful information, but only when that information can be obtained easily and in a timely manner. Information that cannot be easily obtained might as well not exist. Therefore, the goal of iSpartan is to make high-quality information (and high-quality models are the richest source of information chemists can access) easily available.
To accomplish this, iSpartan makes it extraordinarily easy to draw a 2D structure, convert it into a 3D model, download a previously calculated result of meaningful quality, and extract information from this model. If an entry does not exist in the database, iSpartan offers the option of calculating the model’s properties (optimized geometry, total energy, electron density distribution, and optional properties) on a computer acting as a server. This is more practical than performing the calculation on the iPad, partly because the server will offer considerably more computing power, but also because this frees the iPad for other uses. The same computation method is used to create models in the database and to perform calculations on the server. This not only saves time and encourages users to stay focused on problem solving, it also guarantees that all iSpartan models (and, more importantly, all of the information derived from these models) reflect a consistent set of approximations. Therefore, even when approximations may bias a model, comparisons between models will often be valid because both models will reflect the same bias.
References
1) Journal of Computational Chemistry 1996. 17 (5-6): 490–519.
2) Australian Journal of Chemistry 2004. 57 (4): 365–370.
3) Journal of Computational Chem 2001, 22, (9): 976-984.
4) Journal of Physical Chemistry A 2009. 113 (10): 2165–2175.
Back to 3D – Creating and Displaying Models
Estimating Times for Calculations on Spartan Server.
The time required for calculating the equilibrium geometry and wave function (the latter providing access to the molecular orbitals and the electrostatic potential map) depends on several factors in addition to the size of the molecule. These include the number of independent bond lengths and angles, the "floppiness" of the molecule and the "quality" of the geometry guess. The table below lists "typical" relative times for this step for six molecules of increasing size.
formula molecular weight relative time
C4H11NO 89 1
C11H18O 166 10
C14H22N2O2 250 25
C16H25N3O3 307 50
C21H37N3O4 396 100
C24H41N3O6 468 150
NMR and IR spectra may also be requested as can a heat of formation. Adding an NMR spectrum increases the time by only about 3% while adding an IR spectrum increases it by about 80% (don’t ask for it if you don’t need to). Finally, adding a heat of formation increases the calculation time by about 20%. Practical considerations (both time and memory) limit calculations to molecules with molecular weights on the order of 600-700 for geometry, wave function and NMR calculations, and 400-500 for IR and heat of formation calculations. NMR calculations are limited to molecules containing elements that are no heavier than Br, and heat of formation calculations to molecules containing only the elements H, C, N, O, F, Si, P, S, Cl and Br.
Back to 3D – Creating and Displaying Models